Pandas vs. Polars vs. DuckDB: Choosing the Right Tool for Python Analytics
Three ways to do data analysis in Python — pandas the incumbent, Polars the fast challenger, DuckDB the SQL-first newcomer. When each one is the right tool, when the choice doesn't matter, and how they fit alongside dbt and the warehouse.
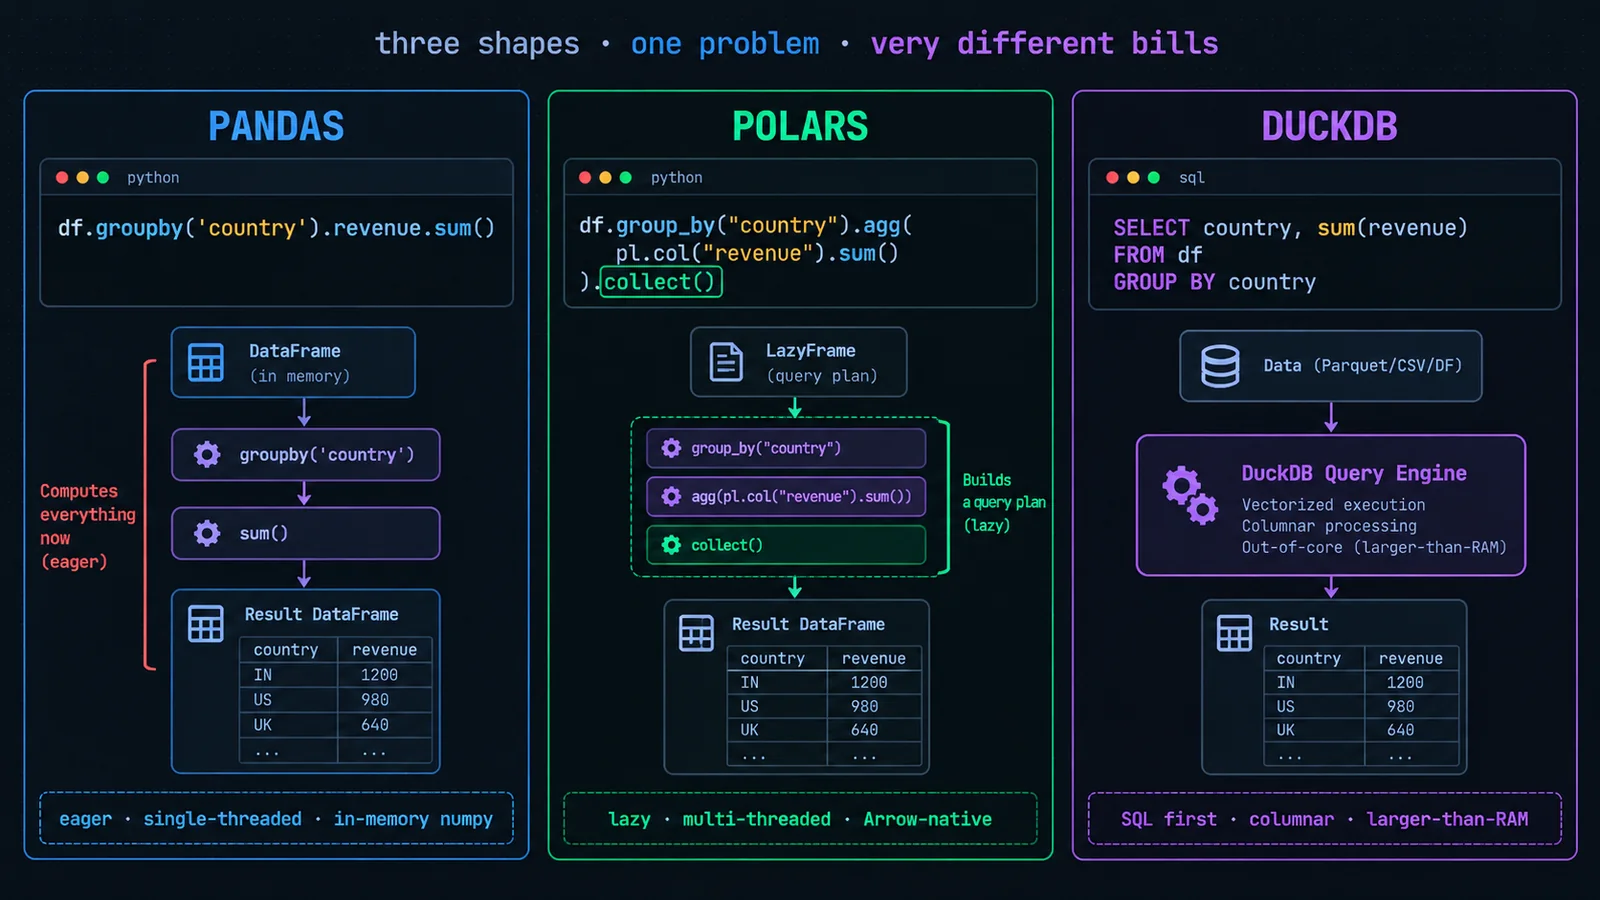
Three Shapes of the Same Job
Analytics work in Python has, for a decade, meant pandas. That was fine when data volumes were smaller and the alternative to Python was moving everything into the warehouse upfront. It's the incumbent, the default in every notebook, the API every data scientist recognises. In 2026 it has two serious challengers that have crossed the threshold from "interesting new project" to "production-grade alternative": Polars, a fast DataFrame library built on Apache Arrow, and DuckDB, an embedded columnar SQL engine that queries dataframes and files directly.
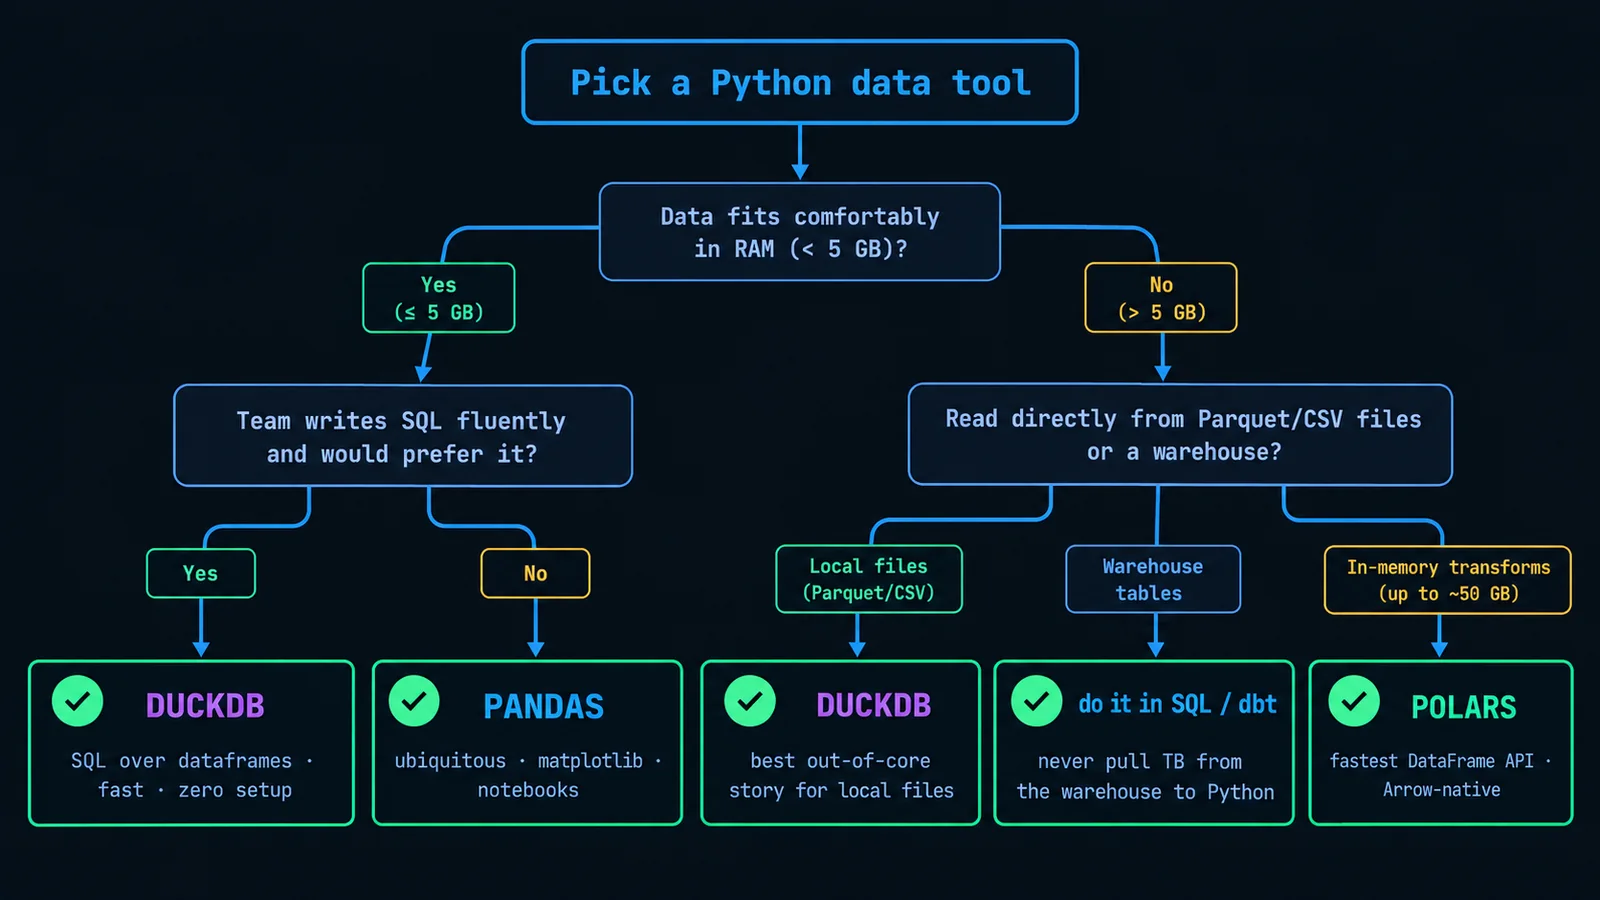
The three-way choice is not "which one wins" — the answer depends on what you're doing. Pandas is fine for a lot of things it's always been fine for. Polars is faster in specific important ways and clumsier in others. DuckDB is a whole different shape — SQL-first — and often the right answer when the alternative was reaching for pandas out of habit.
This post walks through when each is the right tool, when the choice honestly doesn't matter, and how all three fit alongside dbt and the warehouse in a modern analytics team's stack.
Pandas in Two Minutes
The library everyone knows. DataFrame + Series abstractions on top of NumPy. Eager execution — every operation happens when you call it. Single-threaded by default (there are workarounds — modin, dask — that add complications).
What pandas is genuinely great at:
- Notebook analysis and plotting. The integration with matplotlib, seaborn, and plotly is deep. The API is what every stack-overflow answer assumes.
- Small-to-medium data. Anything comfortably fitting in RAM. On a modern laptop that's several GB.
- Model input prep. scikit-learn, XGBoost, PyTorch — everything expects pandas DataFrames or numpy arrays.
Where pandas is genuinely painful:
- Data larger than RAM. Silent OOM or unusable swap. The workarounds exist but they all leak abstractions.
- Multi-column groupby aggregations at scale. Slow, and single-threaded.
- API inconsistencies that have accumulated. Ten years of accretion have produced an API where the "right" way to do something depends on which decade the tutorial you're reading was written in.
None of this makes pandas wrong. It makes it a specific tool for a specific range of problems.
Polars in Two Minutes
Polars is a DataFrame library built in Rust, exposing Python bindings, using Apache Arrow as the columnar memory format. Two things about it fundamentally differ from pandas:
- Lazy execution (optional but recommended). You build up a query plan; nothing runs until you call
.collect(). This lets Polars optimize the whole pipeline before executing — pushing down filters, coalescing operations, choosing better join strategies. - Multi-threaded by default. A groupby-sum uses all your cores without you doing anything.
The API is cleaner than pandas — designed with hindsight, avoiding the historical accretion — and if you're coming from SQL or Spark, the idioms feel familiar. Chained method calls, explicit column expressions with pl.col(), aggregations that don't require a reset_index() afterwards.
Where Polars wins:
- Anything 1 GB to 50 GB in memory. Consistently 5-30× faster than pandas on typical operations, often on smaller data too.
- Production ETL in Python. The lazy API + type safety make Polars pipelines noticeably more reliable than the pandas equivalent.
- Streaming (larger-than-RAM) mode. With
collect(streaming=True), Polars can process data larger than memory by chunking. Not as complete as DuckDB's out-of-core story, but respectable.
Where Polars is still catching up: the ecosystem. Fewer stack-overflow answers, fewer tutorials, thinner integration with visualization libraries (matplotlib support is there via converting to pandas, but native plotting isn't Polars' focus). The API is stable but younger than pandas by an order of magnitude in code-written-against-it.
DuckDB in Two Minutes
DuckDB is an embedded analytical database. Same shape as SQLite (a library, not a server, no daemon to run) but designed for columnar analytical workloads instead of row-based transactional ones. It runs in-process alongside your Python code, and you talk to it in SQL.
The interesting property: DuckDB queries pandas DataFrames, Polars DataFrames, Parquet files, and CSVs in place. You don't import your data into it; you write SQL against it wherever it lives.
import duckdb
import pandas as pd

df = pd.read_csv('orders.csv')
result = duckdb.sql("""
    SELECT country, sum(revenue) AS total
    FROM df
    WHERE order_date >= '2026-01-01'
    GROUP BY country
    ORDER BY total DESC
""").df()
Where DuckDB wins:
- Anything that reads like a query. If the transformation is a groupby-aggregate-sort, SQL is the shorter, clearer statement. DuckDB lets you write it as SQL without spinning up a warehouse.
- Out-of-core processing. DuckDB gracefully handles data larger than RAM by spilling to disk. Genuinely usable at hundreds of GB on a laptop.
- Queries across files. A single SQL statement joining three Parquet files in a directory is trivial and fast. This is where DuckDB is uniquely strong.
- Consistency with warehouse SQL. Your DuckDB SQL looks a lot like your Snowflake or BigQuery SQL — a career-portable skill and a lower cognitive-switching cost.
Where DuckDB is a poor fit: interactive notebook analysis where you're iterating on shape (adding columns, plotting, quick joins). SQL is verbose for that kind of exploration; pandas or Polars methods are shorter.
Performance, Honestly
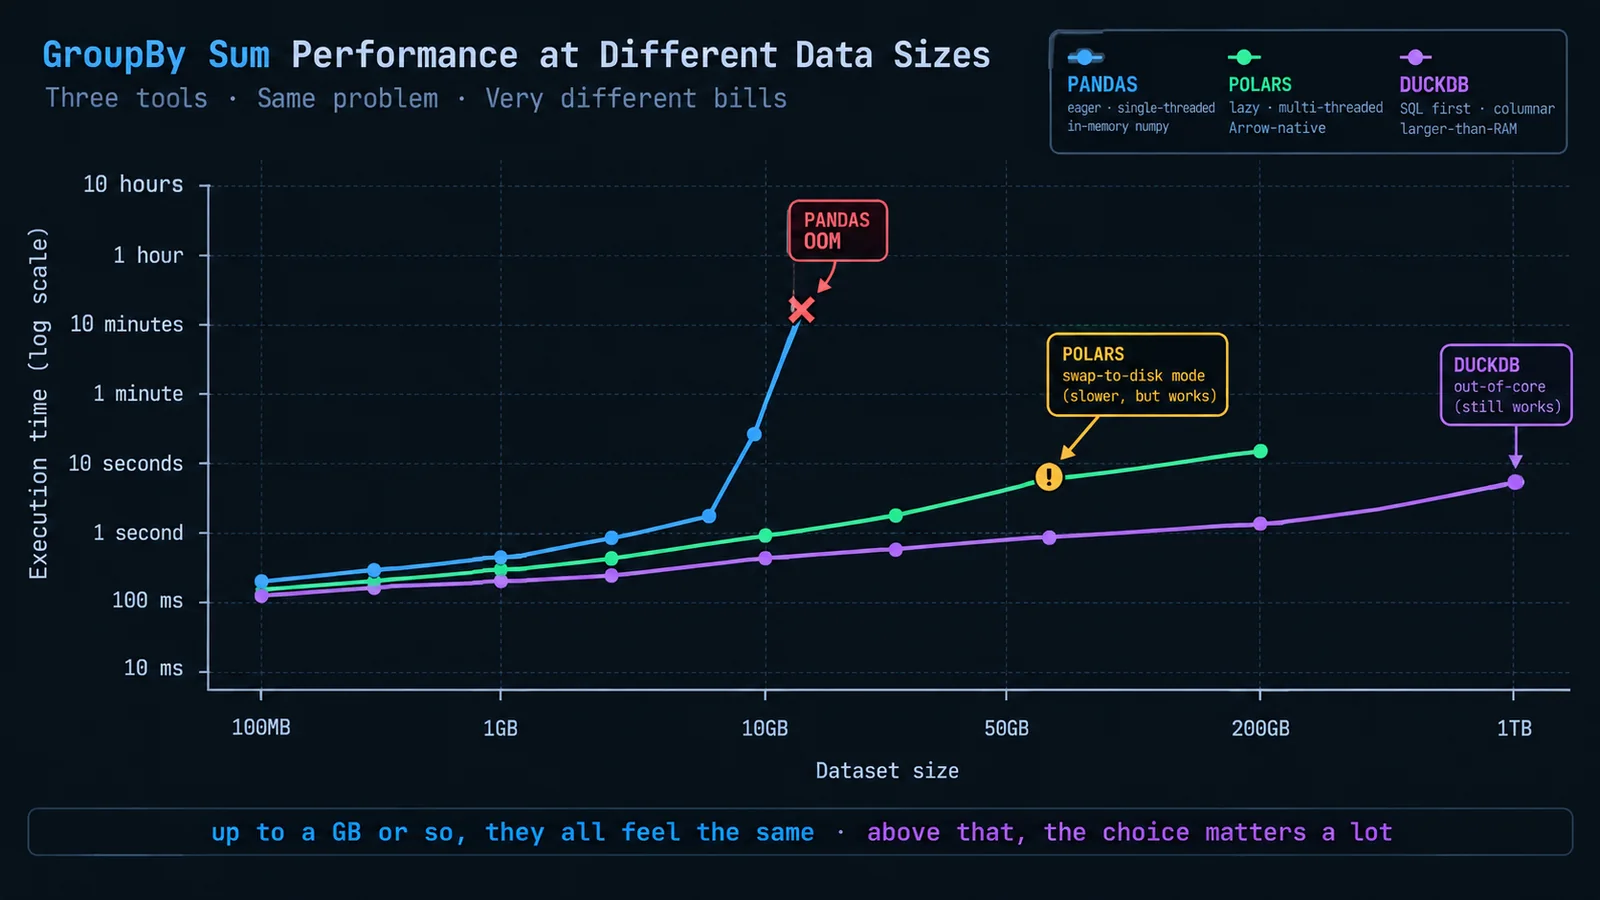
The Twitter benchmark memes exaggerate. The honest picture on typical analytics operations:
- Below ~1 GB: pandas, Polars, and DuckDB feel indistinguishable. The differences are measured in tens of milliseconds. Pick on API preference.
- 1-10 GB: Polars and DuckDB are typically 5-15× faster than pandas on groupby, sort, and join operations. Pandas is still fine if you have RAM to spare and don't mind the wait.
- 10-50 GB: Polars and DuckDB are 10-50× faster, and pandas starts to run out of memory. Polars' streaming mode and DuckDB's out-of-core are both viable; pandas is not.
- 50 GB+: pandas is out. Polars streaming is workable but showing its edges. DuckDB out-of-core is the pragmatic answer up through several hundred GB. Beyond that, you should be querying the warehouse, not Python.
The counterintuitive point: most Python analytics workloads are below 5 GB, where the performance difference doesn't really matter. The reason to reach for Polars or DuckDB in that regime isn't speed; it's API cleanliness or out-of-core future-proofing.
Where Each Fits in the Stack
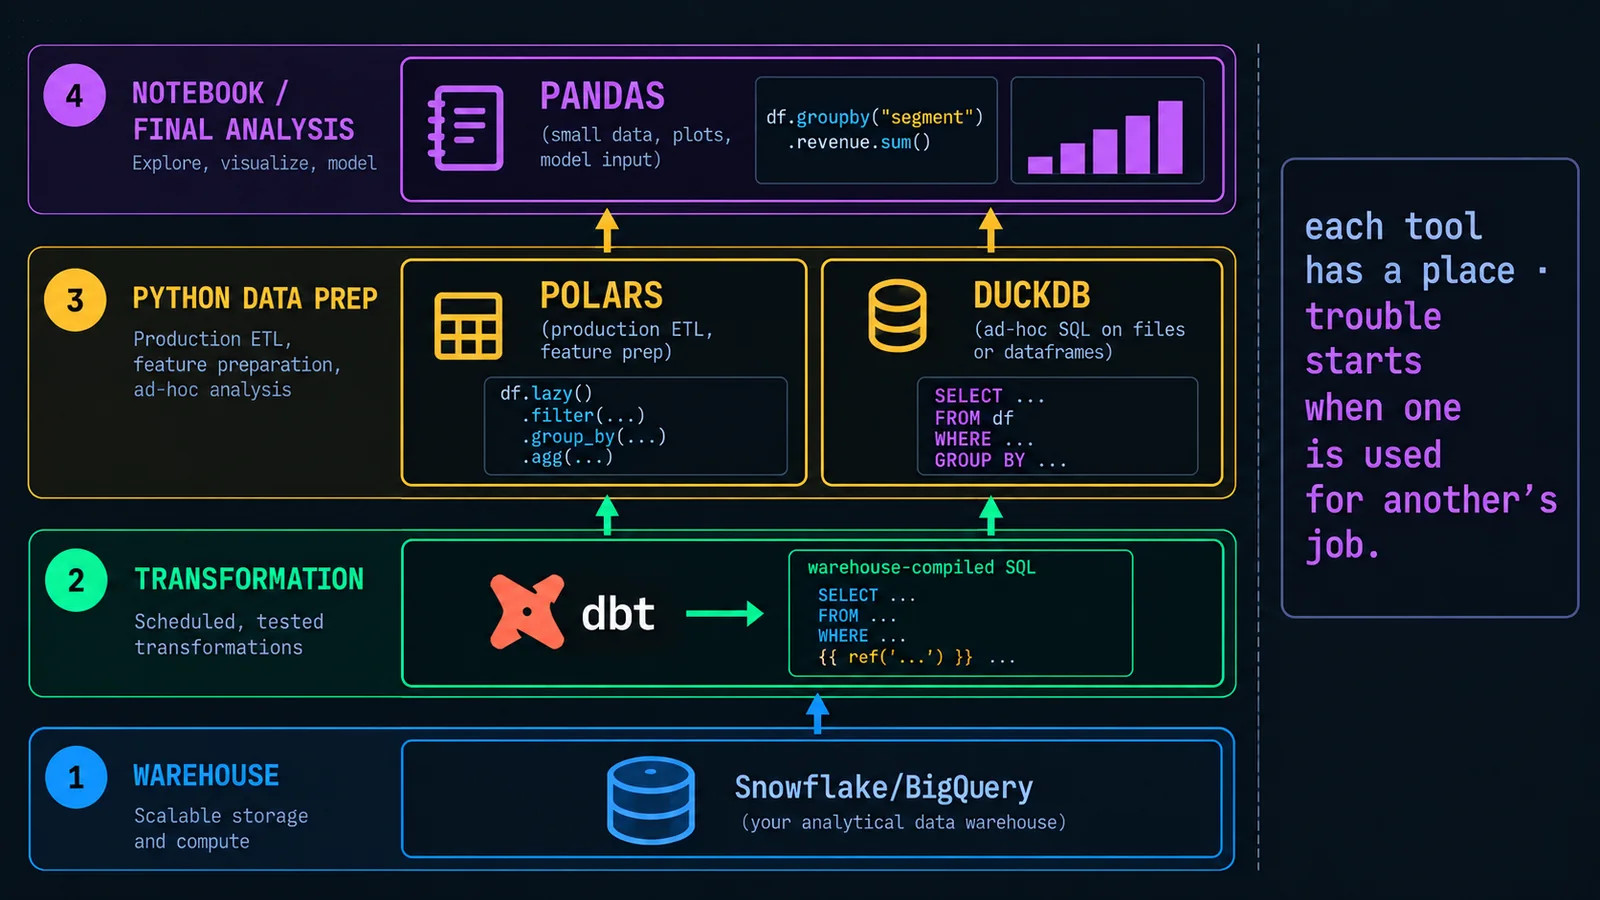
The clean mental model for a modern data team:
- dbt in the warehouse — production transformations, everything with SLAs, anything analysts and BI tools read from. This is not up for debate; the warehouse + dbt is where the truth lives.
- DuckDB or Polars in Python — feature engineering pipelines for ML, ad-hoc analysis on files or dataframes, glue code that stitches together things the warehouse can't (a REST API, an unusual file format, an on-the-fly join). Both are strong at this.
- pandas in notebooks — final analysis, plotting, model input prep. Small data, quick iteration. Pandas is fine here and probably always will be.
The failure modes to avoid:
- Pulling terabytes from the warehouse into pandas. The warehouse is optimized for this workload; your laptop isn't. Do the heavy lifting in SQL and pull the result.
- Reproducing warehouse transformations in Python. If dbt already computes it, don't recompute it in a notebook. Consume the mart, don't rebuild it.
- Choosing pandas out of habit for out-of-core work. If the data doesn't fit in RAM, pandas will lose. Pick Polars or DuckDB.
- Choosing DuckDB for interactive notebook exploration. SQL is verbose in a notebook where you're iterating. Pandas or Polars is faster to type.
Migrating from Pandas (or Not)
The pragmatic take on migration:
- Don't rewrite existing pandas code for the sake of it. If the pandas code works and runs in reasonable time, leave it alone. The migration cost is real and the perf win invisible under 1 GB.
- Do use Polars or DuckDB for new production ETL. The cleaner API and better scaling story pay off over the code's lifetime.
- Do teach juniors both. Analytics engineers and data scientists in 2026 should be at least conversant in Polars and DuckDB, not just pandas. The industry is genuinely shifting.
- Do know the interop. All three convert to and from each other cheaply via Arrow. You can start a pipeline in DuckDB, finish it in pandas, and it's fine.
The interop point is the important one. These tools are not exclusive of each other. A realistic production pipeline reads Parquet with DuckDB, does heavy transformations in Polars, converts to pandas for the last-mile plotting or model call, and nobody has to pick a single tool for everything.
Common Mistakes
- Using pandas out of habit for out-of-core work. Once you're over 5 GB, the choice matters — reach for Polars or DuckDB.
- Rewriting warehouse SQL as pandas. The warehouse is faster and cheaper for the transformations it can express. Don't reproduce them.
- Ignoring lazy mode in Polars. The whole reason Polars is fast is that lazy queries get optimized. Using eager mode throws that away.
- DuckDB in interactive notebooks. SQL is verbose. If you're iterating on shape, pandas or Polars is shorter.
- Assuming Arrow interop is free. Zero-copy between Polars and Arrow, yes. Between pandas (with object columns) and Arrow, sometimes surprisingly expensive. Profile.
DuckDB for Analytics Engineers Specifically
DuckDB deserves a specific note for people already doing dbt-style work. The reason: it’s the most natural bridge between the SQL you write in the warehouse and the ad-hoc analysis that used to require pandas.
Two patterns that have become standard on teams that adopted it:
- Local dbt development against DuckDB.
dbt-duckdblets you run the same project against a local DuckDB file for development, then against Snowflake or BigQuery for production. Iteration is instant, the warehouse bill for dev workloads drops toward zero, and the SQL you write is broadly portable. Not free — some SQL dialects differ subtly — but for a large fraction of models it works well. - Ad-hoc federated queries. Read a Parquet file on S3, join it to a CSV on disk and a dataframe in memory, all in one SQL statement. DuckDB is the tool that finally makes "quick join across these three files" a five-line query instead of a Python script.
For analytics engineers already comfortable in SQL, this is often a bigger productivity win than picking up Polars — because it stays inside the mental model you already use for warehouse modelling. See also the query optimization post — the same pruning and materialisation intuitions apply.
Polars for ML Feature Engineering
The other tool with a specific, well-fitted use case is Polars. Its sweet spot is production ML feature pipelines — the layer between the warehouse and the model, where transformations get complex and per-column performance matters.
Why Polars wins here specifically:
- Lazy execution with query optimisation. A pandas feature pipeline is a chain of eager operations, each materialising an intermediate DataFrame. A Polars lazy pipeline builds up the plan, then executes with fused operations. On a 20-transformation pipeline, this frequently means 10× less peak memory and 5× less wall-clock time.
- Explicit column expressions.
pl.col("revenue").log().over("customer_id")is more readable than the pandas equivalent, and much less error-prone at the "did I really want this scoped by group" step. Groupby-then-transform is the operation that breaks the most in pandas; Polars gets it right by default. - Deterministic types. Polars is strict about types in a way pandas isn’t. This costs a bit of ceremony up front and pays back at the "why is my model predicting garbage on production data" stage.
The interop-with-warehouse story is straightforward: read from the warehouse via ADBC, transform in Polars, write features back to a feature-store table via ADBC. Or, for cases where the transformation could plausibly happen in SQL, do it in dbt instead — the answer is not always Polars just because it’s available.
Interop and Arrow, in Practice
The unglamorous property that makes the three-tool stack actually work: all three speak Apache Arrow as a common in-memory format, and moving between them is mostly zero-copy.
Realistic patterns:
- DuckDB → Polars.
duckdb.sql("SELECT ...").pl(). Zero-copy in most cases, negligible-cost in the others. - Polars → pandas.
df.to_pandas(). Cheap for numeric columns; occasionally expensive if object columns are involved. Profile the specific pipeline; don’t assume. - pandas → DuckDB. Query a pandas DataFrame directly as if it were a table —
duckdb.sql("SELECT ... FROM my_df"). This is the pattern that lets you do heavy lifting in DuckDB while keeping the pandas UX for the last-mile plotting.
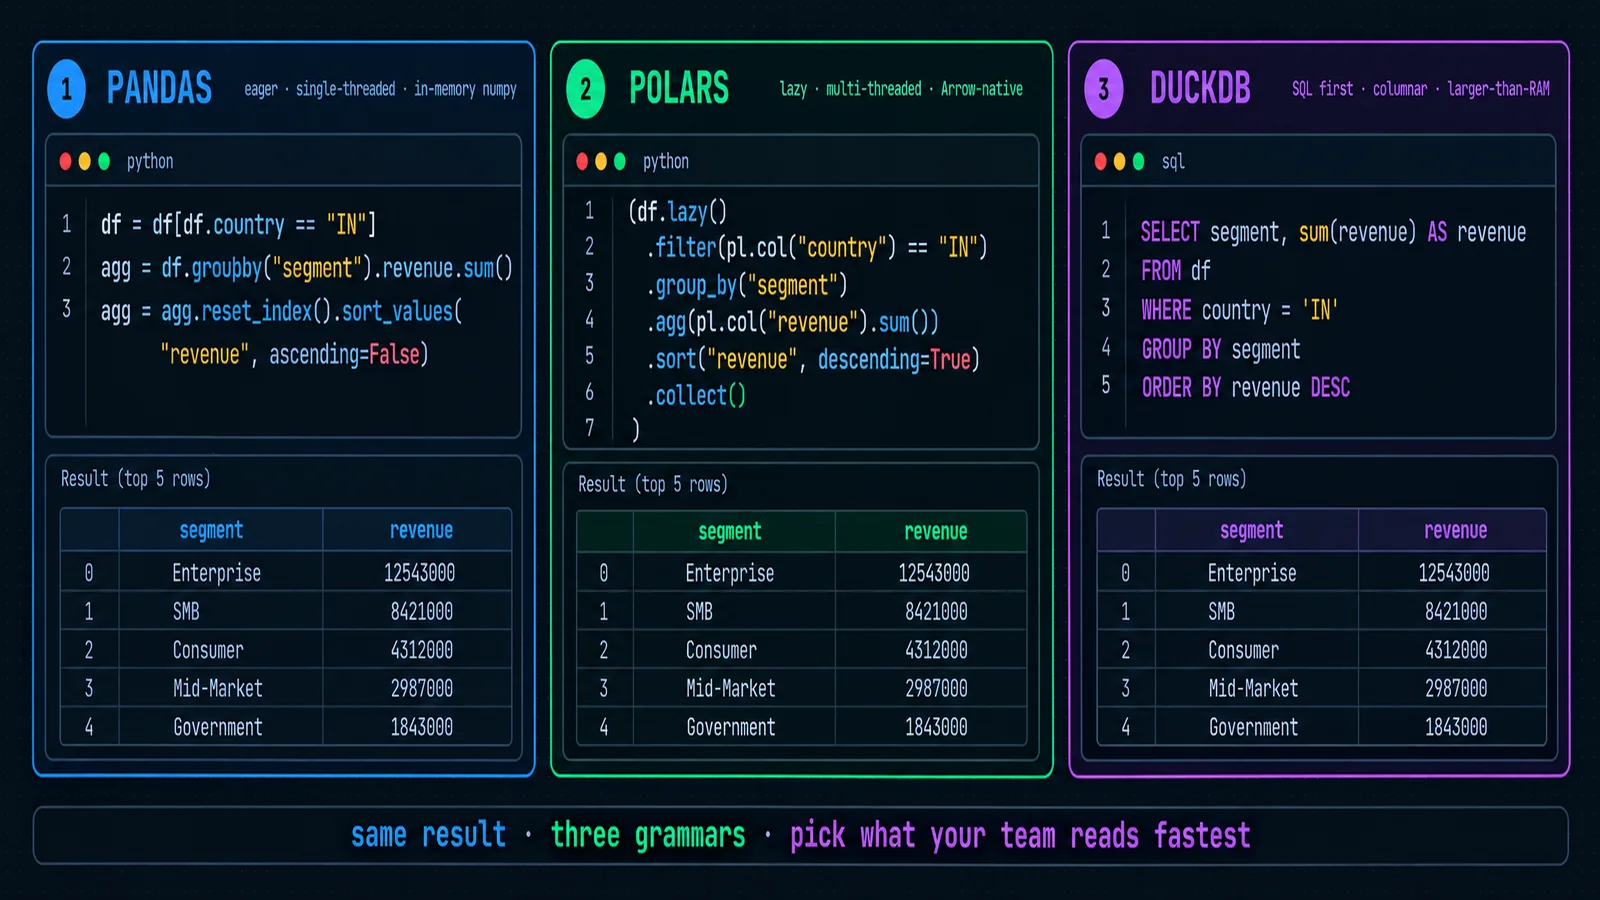
The mental model that emerges: the three tools are interchangeable transport, and the interesting design choice is which language (SQL vs. DataFrame API) each stage of a pipeline uses. Use SQL for the stages that read naturally as queries; use DataFrame APIs for the stages that don’t. Don’t force one grammar on the whole pipeline.
Performance in Context: When It Actually Matters
The benchmark screenshots that made Polars famous look impressive and are also misleading if you don’t know what workload you have. Three shapes of Python analytics workload behave differently under the three tools:
- Interactive notebook exploration. Under 1 GB, a groupby-sum takes tens of milliseconds in all three tools. Pick on API preference; performance is invisible. This is where most data-scientist time is spent.
- Feature-engineering pipeline for ML. 1-30 GB per run, executed frequently, with dozens of transformation steps. Polars often wins by 5-10× wall-clock and much more on peak memory. This is where the switching cost pays for itself fastest.
- One-off large-file transform. A single scan across a 200 GB Parquet directory to produce a summary. DuckDB’s out-of-core execution is uniquely strong here — pandas is out; Polars streaming works; DuckDB is often the shortest path.
The rule that emerges: match the tool to the workload shape, not to the vendor of the month. Reaching for Polars on interactive notebook exploration is unnecessary; reaching for pandas on a 30 GB feature pipeline is a mistake that costs your team hours per week. See the optimization techniques post for the analogous decisions on the warehouse side.
Wrapping Up
One more note for teams still standardising on pandas: the switching cost is much lower than it looks. A senior data engineer can rewrite a moderately complex pandas pipeline into Polars in a few hours, and the resulting code is usually shorter and clearly faster. If you have a specific pipeline that’s expensive, error-prone, or slow enough to be a problem, port that one first — the demonstration is more useful than a whole-team migration announcement.
The three-tool stack (dbt in warehouse + Polars/DuckDB in Python + pandas for notebooks) is the pattern that scales without forcing anyone to give up their preferred tool for the job they know. Give people the freedom to pick per stage, be strict about what the outputs are, and Python analytics in 2026 becomes noticeably less painful than it was in 2020.
Pandas isn't going anywhere. It's the ubiquitous notebook default and it's fine for a lot of things it's always been fine for. Polars and DuckDB have earned their spots — for production ETL in Python (Polars) and for SQL-shaped work at any scale (DuckDB), they are meaningfully better tools.
The right mental model is not "which one" but "which for what." Use dbt in the warehouse for anything with SLAs. Use Polars or DuckDB in Python for the transformations that live outside the warehouse. Use pandas for the last-mile notebook work. The three-tool stack is the pattern that scales.
Above all, don't pull terabytes from the warehouse into Python. That was never the right shape, and no dataframe library will make it one.
— This article is part of an ongoing data-engineering series on techedge.in. Wrestling with any of this? Drop a comment, I read every one.
One email, every other week.
New posts on data engineering, applied AI, and the business decisions around them. No noise, unsubscribe anytime.
Comments
All comments are reviewed before they appear publicly — this keeps spam out.
Loading comments…